IBA CED Impact Dashboard
Internal analytics dashboard tracking entrepreneurship outcomes at IBA CED
A closer look.
Click any shot to open it full size.
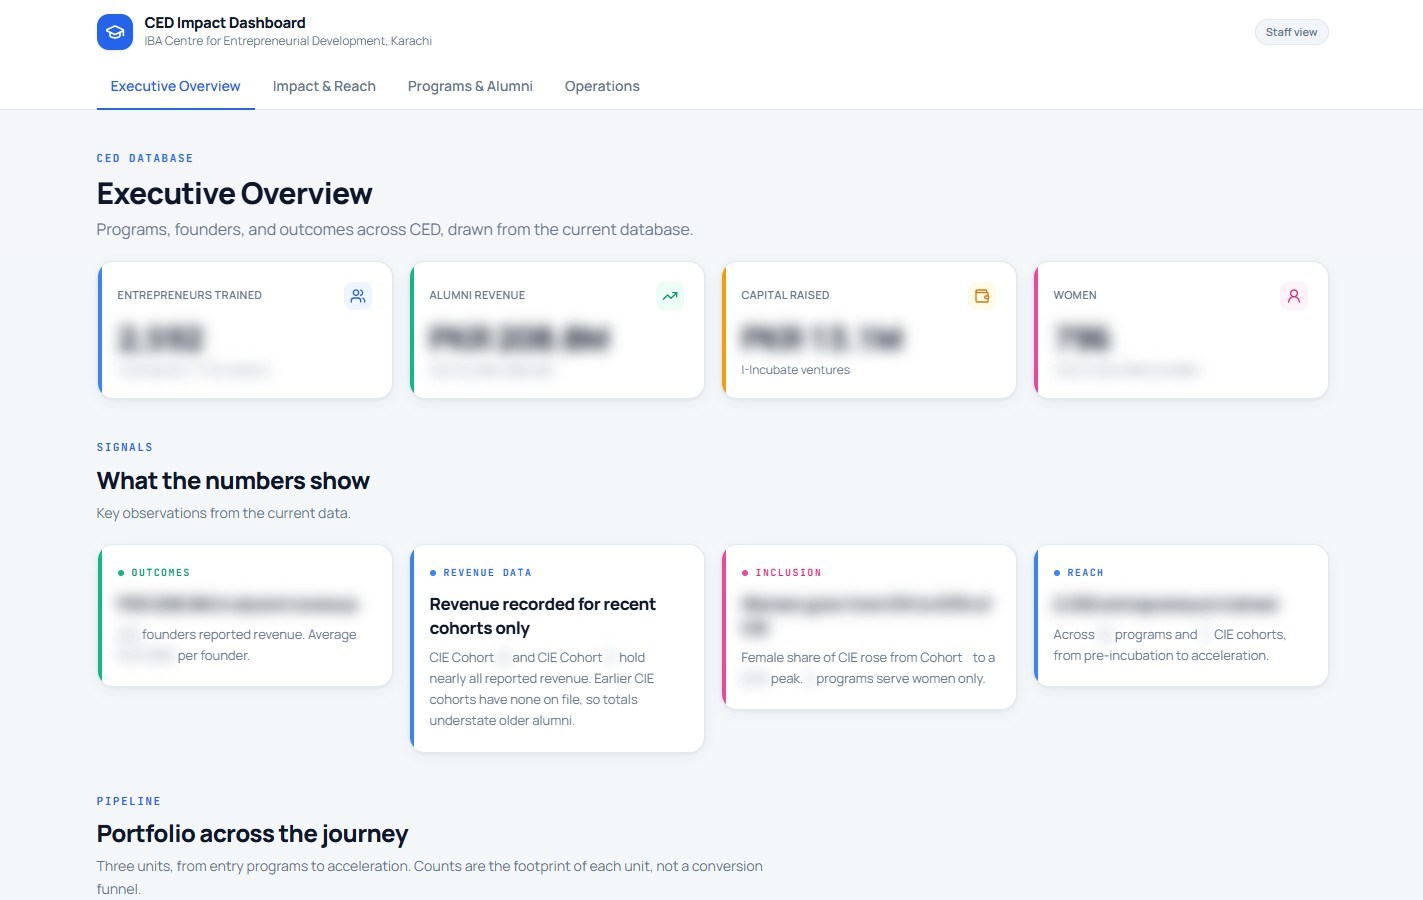
A staff dashboard for the IBA Centre for Entrepreneurial Development. It pulls programs, founders, revenue, and outcomes from the CED database into one view, with interactive charts, a sortable cohort comparison, and per-manager portfolios. Access is gated and the figures stay private.
The challenge
CED tracked programs, founders, revenue, and outcomes across spreadsheets and a database with no single view. Staff had no way to compare cohorts or see per-manager portfolios at a glance.
The solution
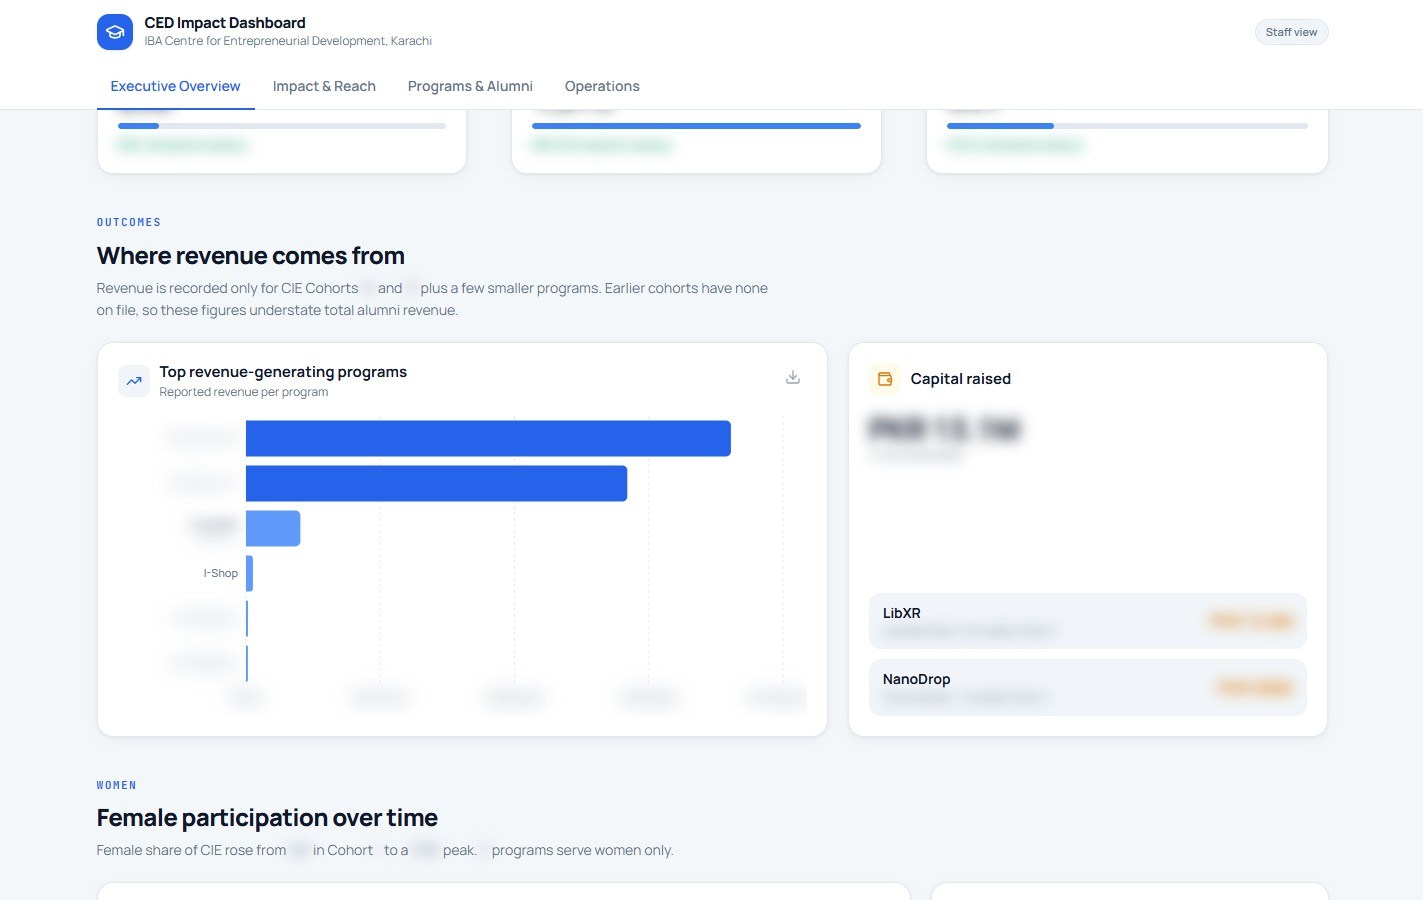
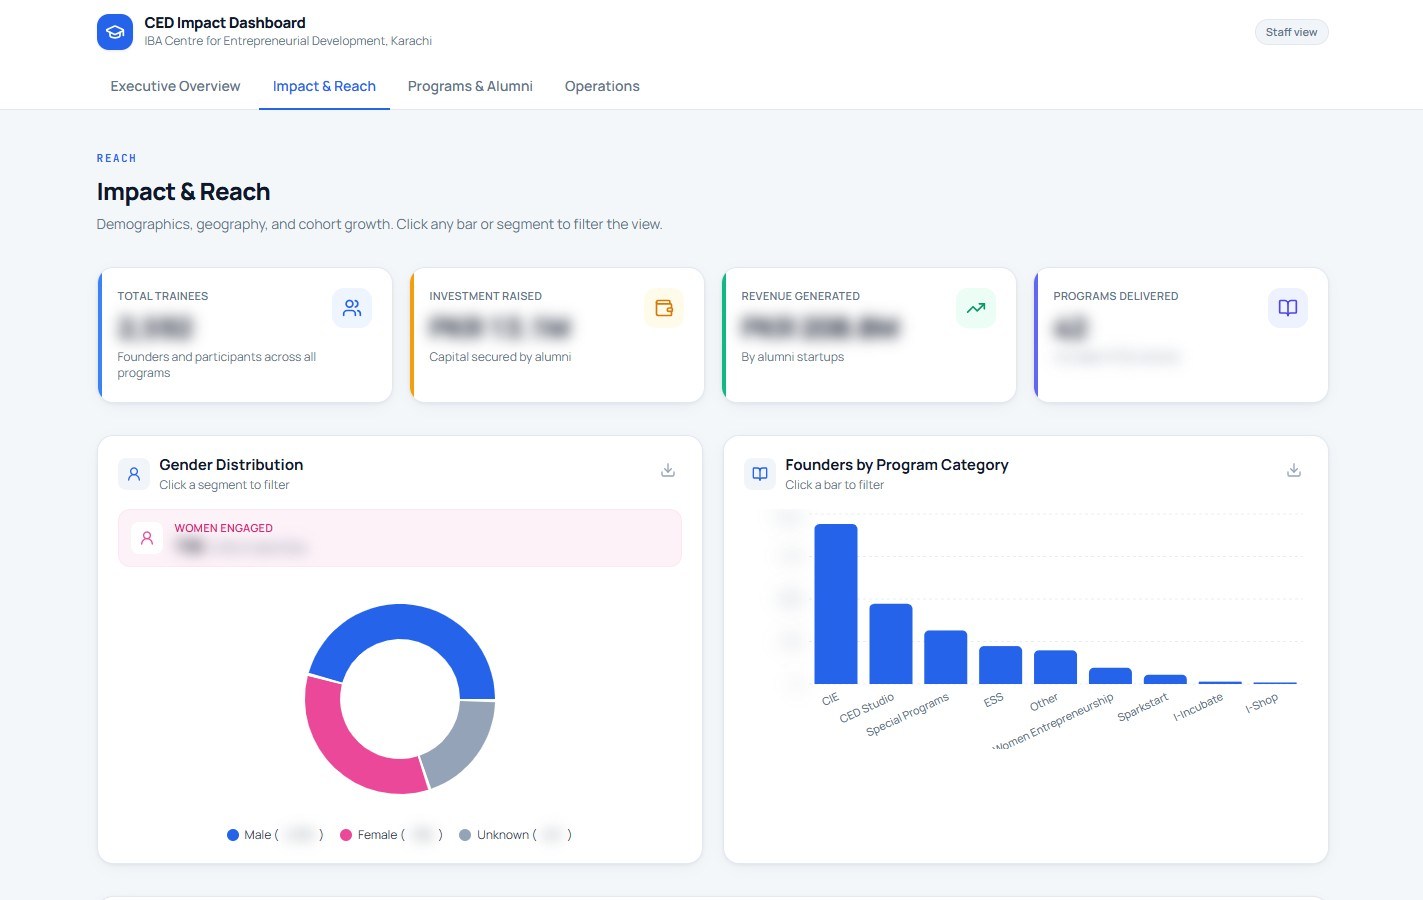
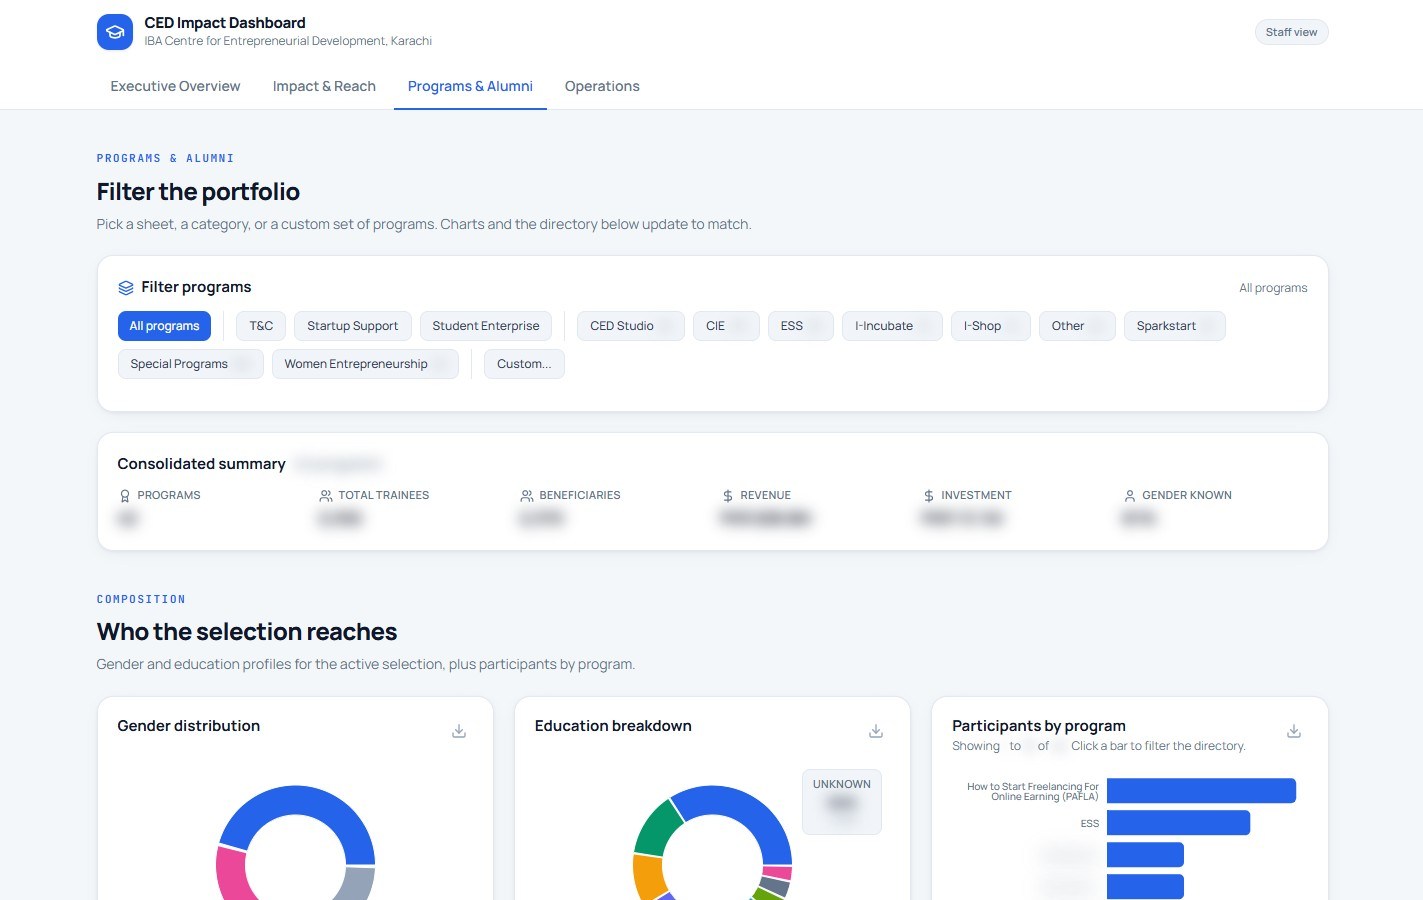
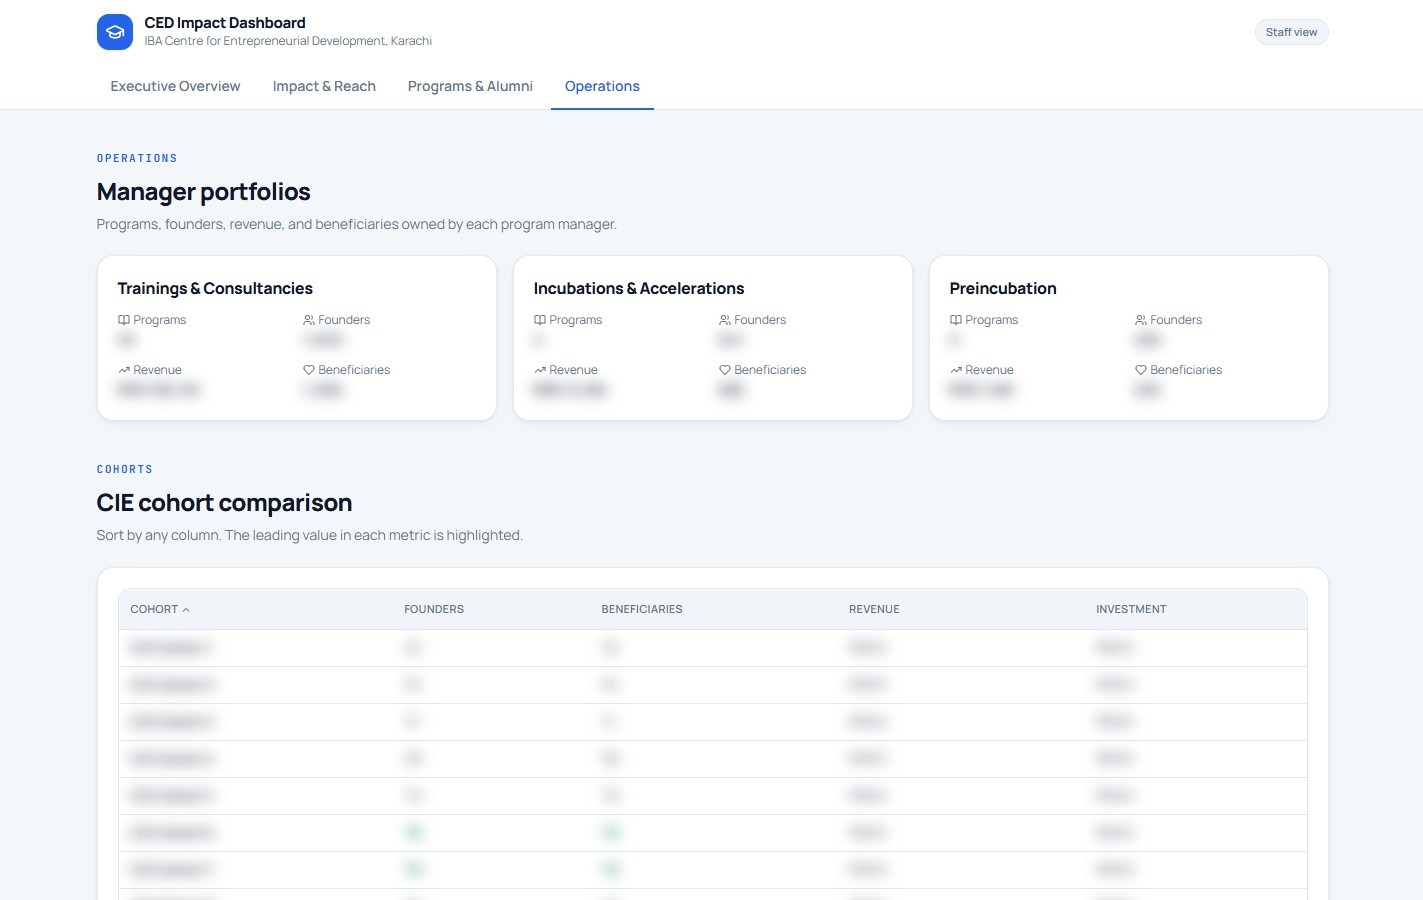
We built a gated staff dashboard that reads from the CED database and presents it across four views: executive overview, impact and reach, programs and alumni, and operations. Charts filter on click, a sortable table compares CIE cohorts, and portfolio cards break down ownership by manager. Access sits behind a code and the figures stay private.
Key outcomes
Under the hood
Want results like this?
These results are strategic, not luck. Book a call and we will map out what works for your business.